FITS file, visualize a BINARY_TBL
You can bring dtspec.fits from :
http://ioda.lal.in2p3.fr/download/data/fits
and deposit the file in your document directory (see Data files).
Then start ioda and select the file with :
Files -> .fits -> dtspec.fits
Whence selected you should see the list of HDUs :
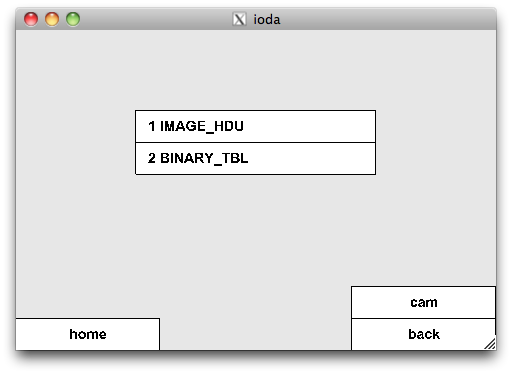
Here there are two HDUs, an IMAGE_HDU and a BINARY_TBL one. If doing :
1 IMAGE_HDU -> keys
you should see :
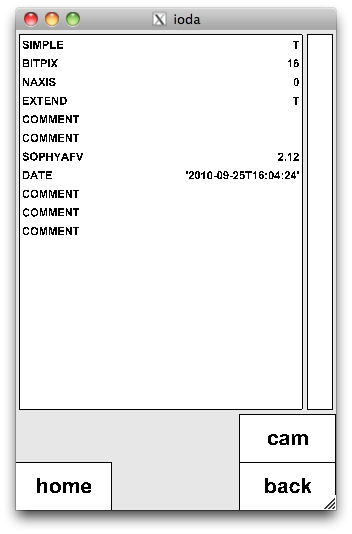
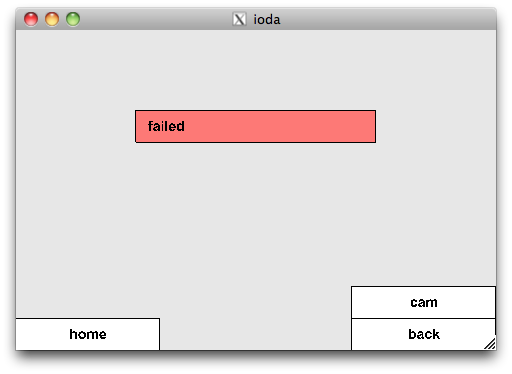
and then see that the "NAXIS" key is 0, which means that the image is empty. If attempting to visualize it you should see at end :
If you go back and select the "2 BINARY_TBL" and then "vis", ioda shows the list of columns with their name and their type.
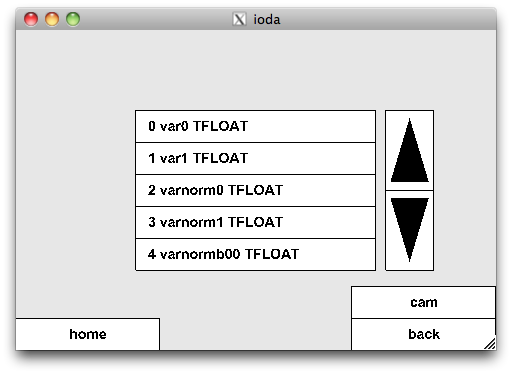
Choose for example the "6 varnormb02 TFLOAT" one. ioda proposes you an "histogram booking panel" with parameters to book a 1D histogram : title, number of bins, min x axis, max x axis and shows you also the mean and rms of the data in the choosen column :
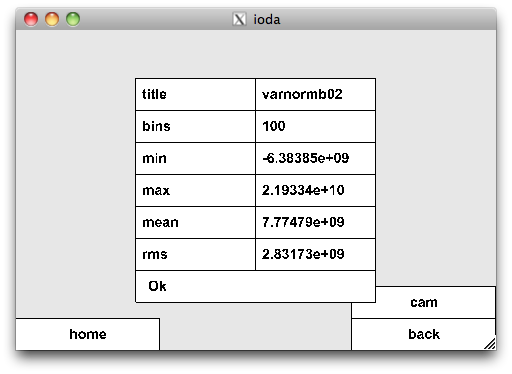
The proposed min/max are :
     hmn = mean - rms * 5
     hmx = mean + rms * 5
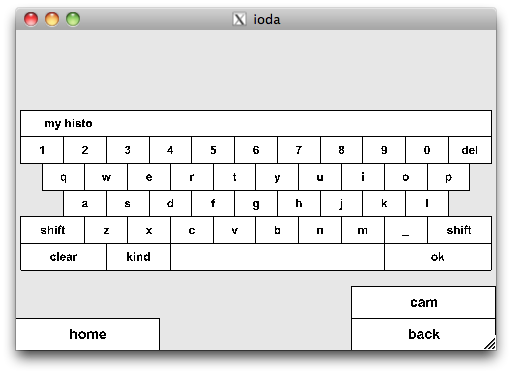
You can modify the proposed title, number of bins, min, max by activating the entry area of a parameter and using the numeric or alphanumeric keyboard.
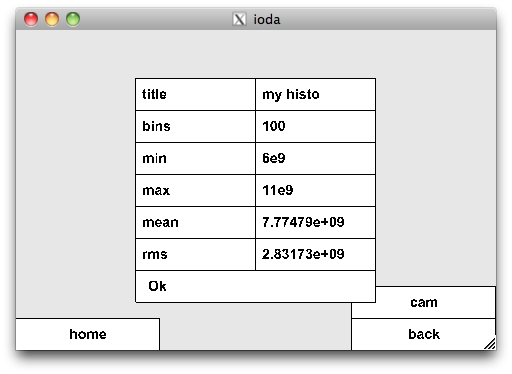
When done, activate the "Ok" of the booking panel, ioda will then create the histogram, fill it with the data of the column and plot it :
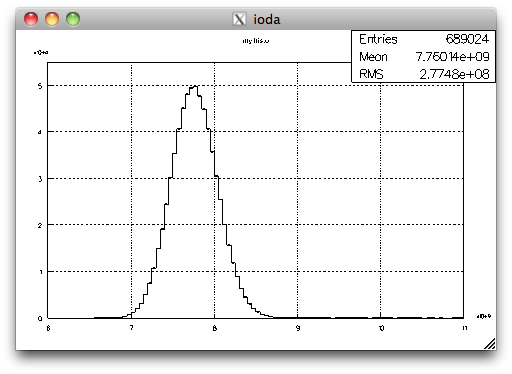
From here you can map the user interface by activating the bottom screen/window area. Then activate the "Home" button and the "out.jpg" to produce a out.jpg JPEG file of the picture.